This is the eleventh in a series of blog posts I’ve been working on during COVID isolation. It started with the idea of refreshing my systems design and software engineering skills, and grew in the making of it.
Part 1 describes ‘the problem’. A mathematics game designed to help children understand factors and limits which represents the board game Ludo.
Part 2 takes you through the process I followed to break this problem down to understand the constraints and rules that players follow as a precursor to implementation design.
Part 3 shows how the building blocks for the design of the classes and methods are laid out in preparation for understanding each of the functions and attributes needed to encapsulate the game.
In Part 4 we get down to business… producing the game using the programming language PHP with an object orientated approach.
Part 5 stepped it up a notch and walked through a translation of the code to object orientated C++.
Part 6 delves into the world of translating the code into object-orientated Java.
In Part 7 the same code is then translated into Javascript.
In Part 8 I slide into the sinuous world of Python and learn a thing or two about tidy coding as I go.
Part 9 explored the multi-faceted world of Ruby.
In Part 10 I started down the path of comparative analysis by asking the question – did all of these languages implement the algorithm consistently, and how would we know if they did?
In Part 11 this analysis continues, with some weird stuff showing up when comparing the outputs of the coded algorithms side by side.
Get in touch on Twitter at @mr_al if you’d like to chat.

Weird Data Science
Depending on the extent of outliers, some of the statistics measures returned from a truly stochastic data set may be ridiculously large. But, in the case of the Auto120 algorithm, they shouldn’t be. This is not a true integer random number generation exercise, despite some of the game moves being based on decisions made on random numbers. It is a rules-based algorithm with a degree of randomness baked into it.
To further complicate matters, each language, each interpreter and compiler – even the platform that the code was run on – adds another noise factor. A different internal algorithm for generating random number results, a different random ‘seed’ generator, a different millisecond time stamp to feed the seed generator, etc.
This is James Gleick’s Chaos Theory writ on a macro scale. Each drop of water from the tap will fall in a different way, of a different size, in a different rhythm and frequency, based on several environmental and physical factors.
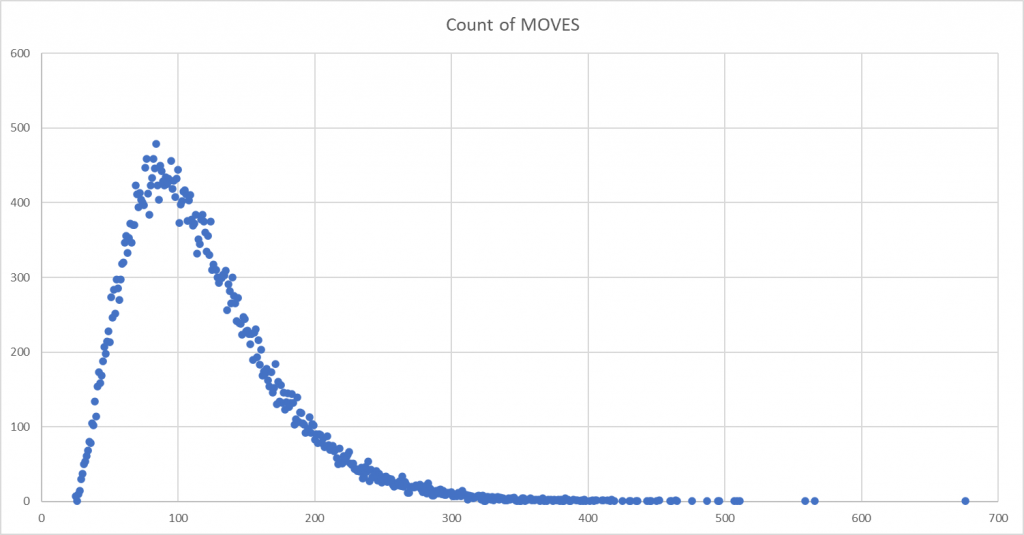
So, let’s look the graphs: [ Y axes are the frequency count of moves, X axes is the count of game moves ]


As you scroll through these, the difference in the final two languages – Python and Ruby – compared to the earlier four languages, is obvious. If it isn’t then here are all 6 mapped on top of each other:

Some quick observations:
- Java, C++ and Javascript appear to show a near identical pattern
- PHP follows close to these, however it’s peak is not as high and the skew to the right is more apparent
- Ruby and Python show a more symmetrical, albeit still right-skewed distribution. The peak is significantly lower that of the other language runs.
On removing outliers
A quick note on the C++ graph. The 49,999 game run produced five games where the move count was a clear outlier – values ranging between 3,000 and over 6,000 moves – which were at odds with the rest of the data. I’d seen this occur during testing as well.
Every now and then the C++ version of the program got into a rhythm of moves that looked as though it was ‘looping’ for several thousand iterations. It was one of the reasons I put a hard-coded exit in the iterations of the main program, so that it did not run ad infinitum and so I could trap logical errors.
In the case of this batch, there ended up being eight data points that I removed – being where there were games of over 750 moves – in order to produce a ‘corrected’ data set.
By the numbers
The following table, using the calculated statistical indicators rather than relying on a visual interpretation, echoes what we see in the composite graph:

I’ve colour coded the language columns to match the colours in the composite graph, with the exception of C++ ‘uncorrected’ which is not on the graph. Some interesting observations:
- The skewness of Java and JavaScript are identical, but their kurtosis and mode vary
- Ruby and Python are so close as to be almost identical. We’re talking 0.5% difference across most indicators.
- The Java, Javascript and C++ distributions, indicated by the Standard Deviation, are also very similar.
- C++ seemed to be the most efficient ‘player’, with the lowest number of average moves across all games – even taking into account the uncorrected run. However, Java had the lowest mode, indicating that there were a higher number of lower-move games.
I expected the runs to vary a little – but did not expect them to vary with such significance. The next step was to try and figure out why.
Next post… looking for ways of understanding what was causing the difference in output.
